IT & Engineering
Is your A/B test bullshit?

Easy as pie?
Everybody knows about A/B tests; You have version A and version B and want to know which one is better. You show some people version A and some people version B. They either like the version or they don’t, and whichever version gets more likes wins. Pretty simple, right?
But how many people should you show versions A and B? 10, 100, 10000? What if 10 people like A and 7 people like B? Does it mean A is better than B? What if you continued the test? What if your sample size affects your results?
Here is a simple example. A company runs a survey to figure out brand awareness. 6 out of 10 people say they know the brand. After an advertisement campaign, the company runs the survey again. This time 44 out of 100 say they know the brand. Was the campaign effective? 60% vs 44%, but the truth of the matter is — we can’t tell!
How many of you have run such surveys and made business decisions based on them?
A simple solution
Before you throw your hands in the air and give up on A/B tests altogether, there is a way you can check your tests to see if they’re legit. A simple solution is an A/B test calculator like this one:
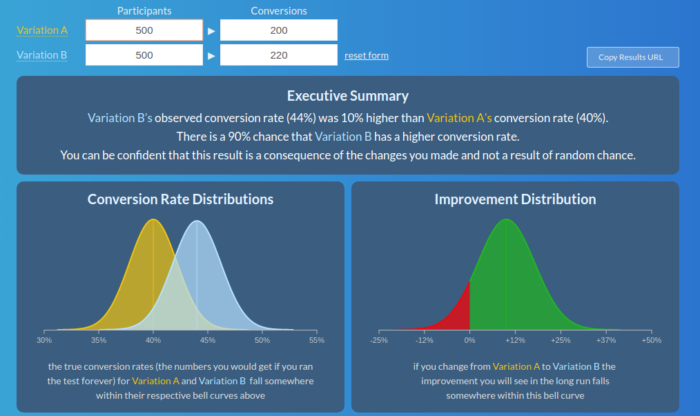
All you do is enter the number of participants that saw version A/B and how many of them liked it / converted. In response, it tells you the chances version B is better than A or vice versa. It also gives you some nice visualizations that apparently relate to your data though you might have no idea how.
Why the conversion rate looks like a bell
When you run an A/B test, a user can either click on the link or not. The answer is binary — like flipping a coin; heads or tails, 0 or 1. Such random variables follow the Bernoulli Distribution with a known Expected Value or Average and Variance. Don’t worry if you get confused by these statistical terms. The point is, A/B testing has a known “shape” that is fully defined by two parameters – average and variance.
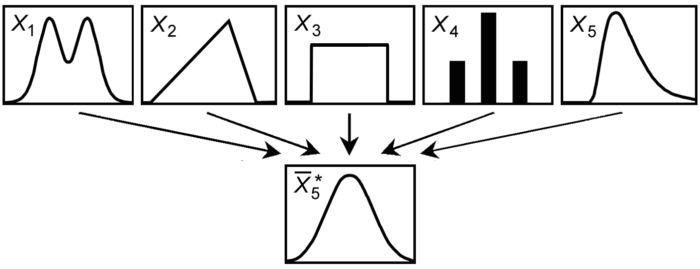
If you think about it, the conversion rate is the “average” answer by definition. The problem is, we don’t know the “true” average: each time we ask X amount of people to evaluate variant A/B, the average will be different. Consider the average height for groups of characters in this picture:

In other words, the average itself is a random variable. Luckily for us, there is a Central Limit Theorem that says no matter what the original distribution is, its average has a Normal Distribution. It’s informally known as a “bell curve”, with the same Expected Value and the X times less Variance:
That’s where the original Bernoulli distribution with its Expected Value and Variance come into play. The center of the bell is where the Expected Value is. The Variance defines how wide the bell is going to be. The more people you ask, the narrower the bell becomes, giving you a more accurate conversion rate.
Comparing two bells
So how do you compare the two bells? The theory says that for two normally distributed random variables Student’s t-test can be used. Given the distributions, it calculates a certain value that, if the averages are equal, falls somewhere within Student’s t-distribution. If the value is “unlikely” for the Student’s t-distribution, it means the averages are not equal.
The Student’s t-distribution
The Student’s t-distribution looks very much like the bell curve, but it’s not. The calculator’s Improvement Distribution chart should actually be the Student’s t-distribution:
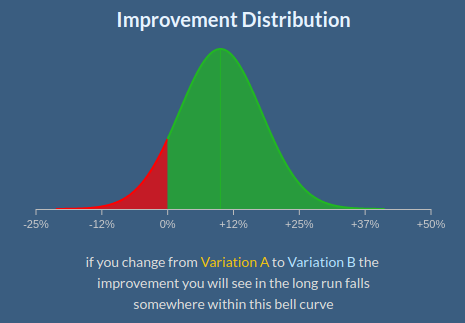
The border between red and green corresponds to the calculated value. The red area under the curve covers more “extreme” values. Its square is the probability to get such values if averages are equal. The lesser the value is the more “unlikely” it is.
One and Two-Tailed Tests
Note that in our case, without looking at the data we can’t reasonably suggest which variant – A or B – is better. To be “extreme” can mean either exceed or underperform:
Depending on whether you test only for low/high end or both the test is called one- or two-tailed and some A/B test calculators allow you to run both.
To Summarize
We took the simplest and most obvious solution possible — an A/B test calculator. We put in our data and got the answer. The answer tells us if variant B is better than A, it also but it also gives us the certainty in percents, as well as some nice visuals that serve as both an illustration of the result and as an explanation of the thought process. The service is easy to use, and the answer is both scientific and nice to look at. There is no way the answer could be wrong, yet the calculator “forgot” to add another tail.
Actually, it’s not even an error. There are cases when one-tailed tests can be used, but not in this one. While the difference is often negligible, sometimes it results in the opposite answer to the original fundamental question: “Is variant B better than A?”.
As H. L. Mencken once said “for every complex problem there is an answer that is clear, simple, and wrong”. You don’t have to be a data scientist to run A/B tests. There are A/B test calculatorsthat can do things for you, but you have to understand what the calculators are telling you. Once you have a better understanding, you can start creating A/B tests with substance.
What’s next
Now that you know hopefully more about assessing A/B test results, you’re probably running to do some A/B tests, assess, do some more, continue until you get statistically significant improvement for my use case. But that instinct would actually be wrong.
Consider flipping a coin. You get tails the first 10 times, which is statistically significant. So you say it’s bullshit that there is a 50% chance when flipping a coin. But continue and you get 49 out of 100.
So how long should you be running a test? In other words how many users should you ask? Originally, I wanted to write another blog post, but there’s no way I can put it better than Noah Lorang in his awesome article A/B Testing Tech Note: determining sample size. Once you figure that out, create some tags and try out some A/B testing for yourself.