Product
Mailgun launches new reporting dashboard
This was originally announced on August 17, 2016.
Today, we’re excited to launch the new reporting section of the Mailgun dashboard. Our goal was to develop a new set of reports to provide better visibility into the messages that are being sent through the Mailgun service.
Suppressed vs. Dropped Messages
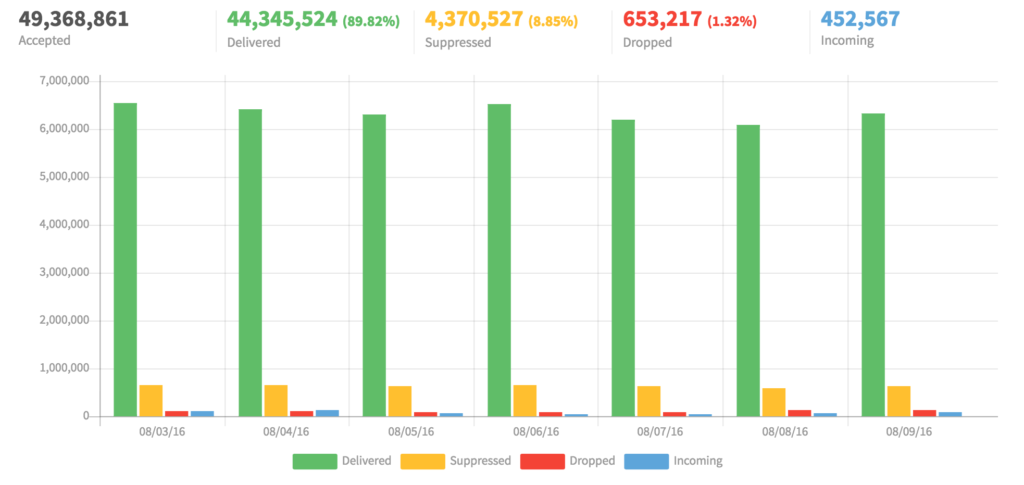
One of the key changes we’ve made was distinguishing between messages that have been suppressed versus ones that have been dropped. When Mailgun is suppressing a message, our systems are proactively deciding not to attempt to deliver a message to protect your sending reputation. This occurs because a user complained, unsubscribed, or a bounce previously occurred. Dropped messages indicate actual delivery failures and often warrant further investigation, especially when there are unexpected changes from week to week.
By separating out these two metrics, you are better able to understand your actual delivery rate for your transactional messages and marketing campaigns. The new overview section makes it simple to calculate your “true” delivery rate by discarding messages that have been suppressed.
Advanced Filtering
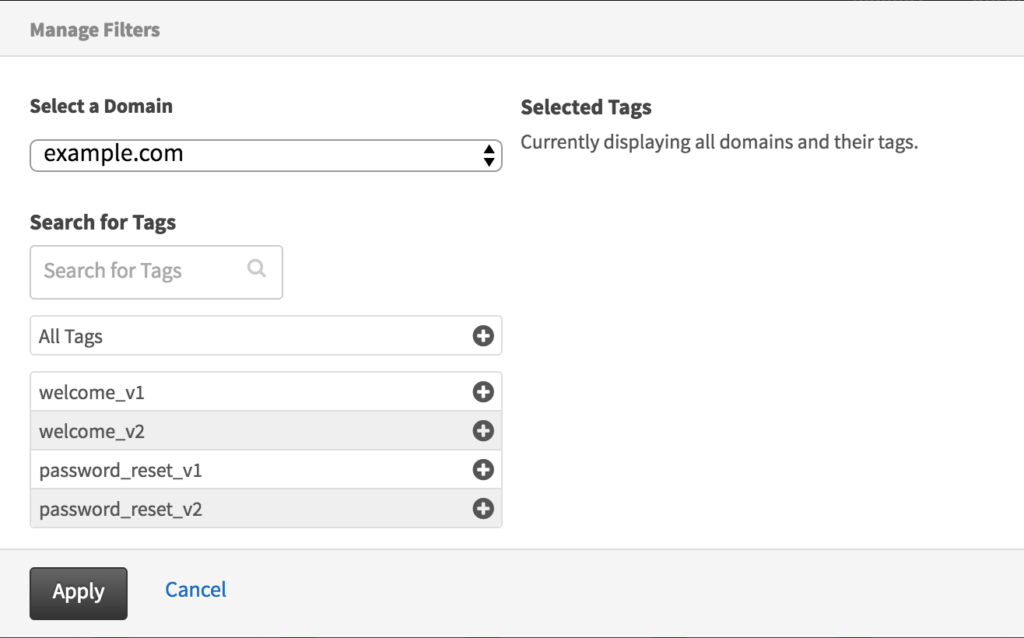
The report filters allow you to segment your data by either domain or tags and give you the ability to compare campaigns and different categories of messages against one another. Each message you send through Mailgun can have up to three unique tags applied. Tags are applied dynamically to messages as you send them through either our API or SMTP endpoint, if you are unfamiliar with message tagging, you can learn more here.
Each chart in the dashboard allows you to selectively show or hide different metrics in the chart to improve your ability to compare the selections you care most about. Additionally, depending on the date range you’ve selected, you can easily toggle between hourly, daily, or monthly aggregates.
Engagement
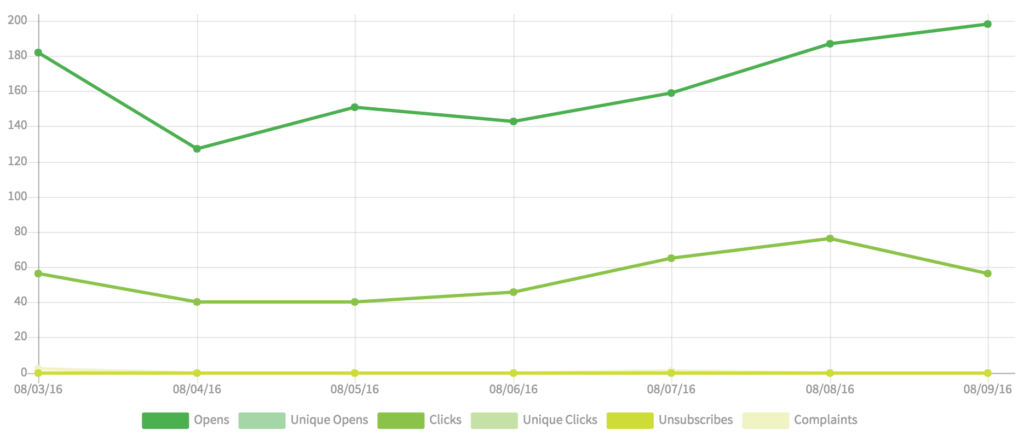
Simple open and click counters are not enough to determine how many users your messages are reaching since users often click or open messages multiple times. When you are using tags, we provide unique clicks and opens that give you an exact measurement of how many distinct users are engaging with the messages you are sending.
The engagement report also gives you visibility into total clicks/opens, unsubscribes, and complaints so you have a complete picture of your engagement with both positive and negative events shown.
Data Exports
Each and every table can be easily exported as a CSV file allowing you to import this data into your business intelligence tool of choice so that you can combine your e-mail engagement data with other analytics data you already use to manage your business.
Furthermore, our reporting section is built on top of our stats API giving customers the ability to programmatically pull all of these metrics from our service at any time.
Get Started
The new reporting section is available to customers on all of our plans. If you aren’t yet using Mailgun, sign up below!