Product
Announcing new analytics features to maximize your email performance
Navigating email analytics has never been easier than with our latest updates. Advanced data analysis, faster performance, and better data management tools have been released with our sender’s goals in mind. Discover how these feature enhancements to data manipulation, speed, and convenience can optimize complex email programs and streamline your operations.
Over the last year, we’ve been continuously working to improve Mailgun’s analytics capabilities so that our customers can better understand their email performance and see where there’s room for improvement.
We’re excited to launch several new features today that will provide greater visibility into the performance of your messages.
An Overview of the New Analytics Features
Managing analytics at scale is a complicated ask, especially if you are managing a myriad of IPs, domains, and subaccounts. What’s more, not all analytics features are created equal. Data should be relevant and actionable, and analysis needs to be fed real-time data. We’ve just rolled out a complete overhaul to how we process and present analytics. Here’s the short list:
- Advanced data analysis: A multidimensional approach to data, view data and get granular with 10 different filtered data points.
- Speed and performance: OLAP cube technology powers analysis across large quantities of data for complex queries.
- Data management: Save and configure report settings, customize displayed engagement metrics, and schedule and send reports to stakeholders.
How we designed and executed for value
Understanding how email is consumed is our bread and butter, it’s also the key to figuring out the best way to manage and scale account data for senders. To do this, we focused on efficiency-first solutions from scheduling capabilities to streamline your reporting processes, to incorporating OLAP cube technologies and real-time datapoints to inform and process data. Ultimately, we had three goals:
- Make it easy to manage large multi-tenant email programs to make it easy to pinpoint problem areas faster, help shorten response times, and improve operational efficiency.
- Leverage real-time data to maintain more performant email programs leading to better sender reputation and email deliverability.
- Help you to work smarter and faster with improved application performance and the ability to schedule, save, and send reports.
Let’s take a closer look at how our major feature updates contribute to these key goals.
Advanced data analysis
There are two sides to our advanced data analysis, a multidimensional data approach and custom filtering.
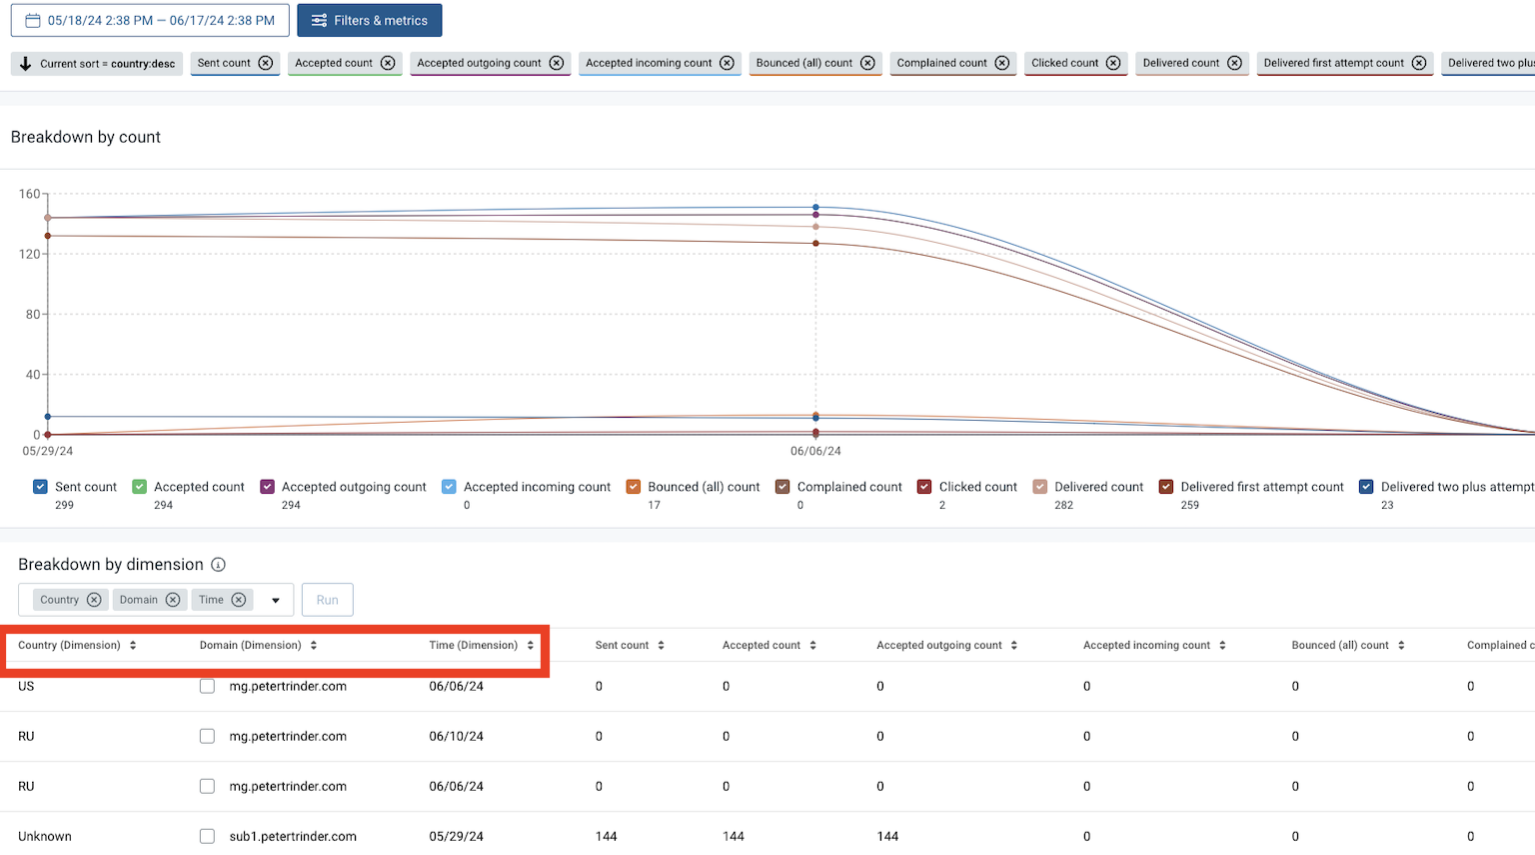
Multidimensional data
Multidimensional data means the ability to select up to three dimensions to view in a single pane of data. Imagine seeing your email performance broken down by bot activity, country, and domain – all in one view. This feature allows you to mix and match how you interact with your data. Choose from any of these 10 dimensions:
- Bot
- Country
- Domain
- Time
- IP Pool
- Sending IP
- Recipient Domain
- Recipient Provider
- S뫌ount
- Tag
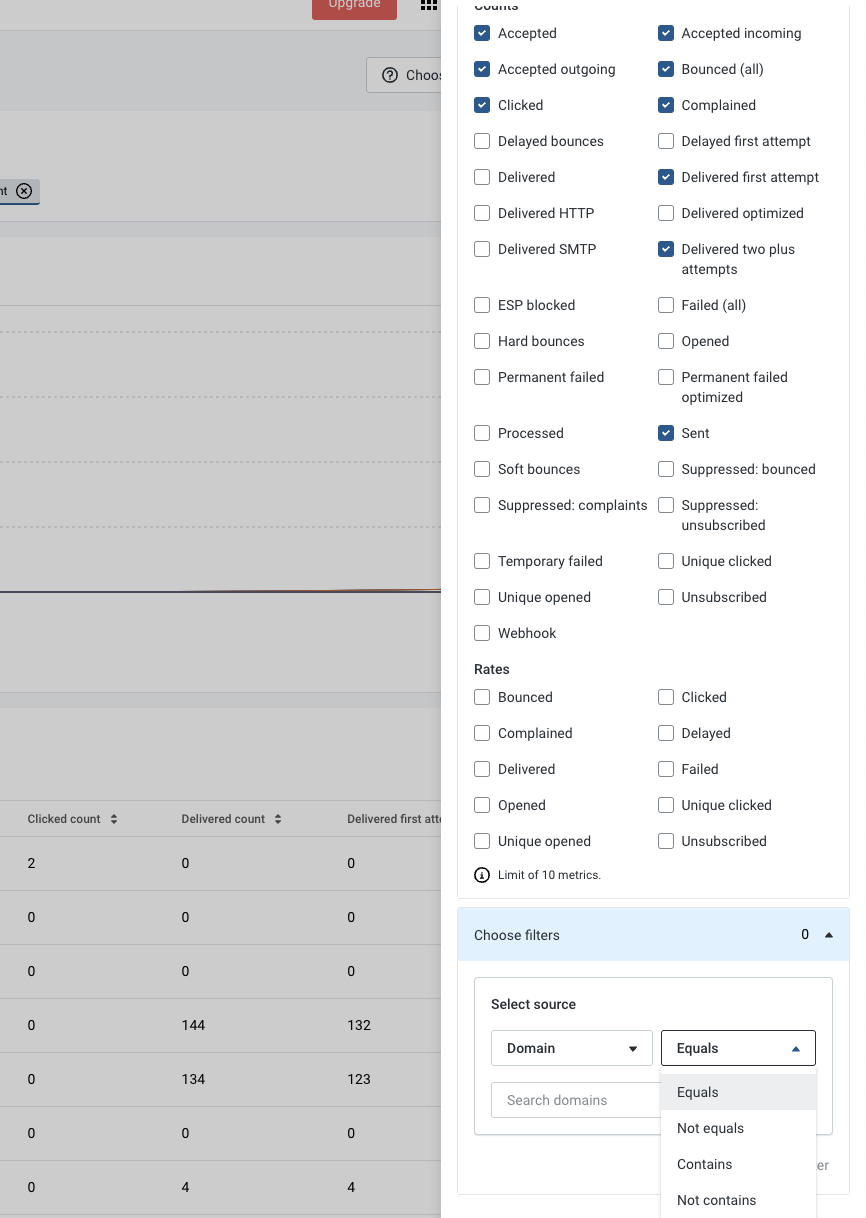
Custom filtering
Our new analytics suite also brings advanced custom filtering capabilities. You can track and select all the key metrics you’re used to, but now with added flexibility and over 40 data points. Filter your data by domain, country, IP, and more, and use exact or fuzzy match style filtering with options like “equals,” “does not equal,” “contains,” or “does not contain.” This allows for a more detailed and nuanced analysis of your email performance, helping you pinpoint specific issues or trends.
Speed and performance with OLAP cube technology
Speed and performance have seen a significant boost with the introduction of OLAP cube technology. This advanced database technology allows Mailgun to analyze large amounts of data from various perspectives, providing fast and accurate results even for the most complex queries. This means you can get the insights you need without the long wait times, enabling quicker decision-making and more responsive email management.
Monitor and reduce bounces with integrated Bounce Classification
Monitor your bounces and filter by mailbox provider (like Google, Yahoo, and Comcast), spam filter (think industry leaders like Barracuda and Spamhaus), and bounce category with Bounce Classification. The feature works by identifying the bounces which result from your actions as a sender. This eliminates most soft bounces that might register due to temporary issues like network interruptions, and focusses in on the bounces that impact your deliverability the most:
Why do you need more tools to manage your email bounces? You may think that managing your email list and addressing bounced emails on an address by address basis is enough. While this approach certainly works for hard and soft bounces at an individual scale, your bounce rate can sky rocket when their is a more systemic issue at play – that’s what this new tool is designed to detect.
Data Management
Our mantra for data management is schedule, save, send and we say it to ourselves often to soothe the symptoms of data paralysis. Data can be overwhelming to analyze, but managing your data has never been more convenient.
With the new Mailgun analytics, you can save configured report settings, allowing for customized reports based on your specific needs, such as positive versus negative engagement or deliverability stats versus engagement stats. Additionally, you can schedule these reports to run automatically at selected dates and times and have them sent via email to different stakeholders, ensuring everyone stays informed with minimal effort.
Make email analytics work for you
These analytics updates benefit all senders, but particularly if you are a sender managing complex email programs. If you deal with multiple Ips, domains, and subaccounts, you know how important the right view of data can be. With multidimensional data, advanced filtering, and the ability to save reports, high volume, complex senders can achieve the granularity that’s needed.
Mailgun Send’s email analytics platform provides configurable, real-time email data to help senders and platform managers maintain peak email performance through insight and visibility. It’s with multidimensional data, advanced filtering, unmatched speed, and simplified management that we can help our senders beat the competition.
Start exploring! Log in to check out the new Analytics tab and gain the insights you need to maximize performance.
“Mailgun brings us an opportunity for growth and offers the best customer experience to the clients. Above all, what we really liked was the statistics it offered us. We love to analyze, and we have lots of metrics to study new email strategies. This information is the key for [successful] e-commerce.”
Not a Mailgun user? Sign up now to start taking advantage of our advanced email analytics capabilities.